What is the number one greenhouse gas?
CO2 is the primary greenhouse gas - accountable for app. 75% of greenhouse gas emissions in 2018.
Based on data from ClimateWatch approximately 75% of the world’s greenhouse gas emissions are from CO2 – and this is often the main associated synonym with greenhouse gas emissions. CH4, F-gas, and N2O can have a potent effect in the short term according to ClimateWatch (read more here).
Overview of greenhouse gas emissions by sector
Hannah Ritchie and Max Roser (2020) - "CO₂ and Greenhouse Gas Emissions". Published online at OurWorldInData.org. Retrieved from: 'https://ourworldindata.org/co2-and-other-greenhouse-gas-emissions' [Online Resource]
From a product engineering point of view which sectors can be influenced by design?
The most relevant sectors are pointed out below:
- Electricity and heat
- Transport – to some degree (either by logistics or improving the products that account for the emissions)
- Manufacturing and construction (the manufacturing part especially)
- Industry
- Waste (especially production scrap)
- According to worldsteel.org the material efficiency (“% of materials converted to products & co-products”) for crude steel is app. 98%.
- Other fuel combustion
- Aviation and shipping (optimization of products – performance and materials)
Another, more detailed view, from “Our World in Data” (2016):

The interesting groups from a product development point of view are:
- Iron and steel (7.2%)
- Machinery (0.5%)
- Other industry (10.6%)
- Transport (16.2%)
In total – approximately 33% of global emissions.
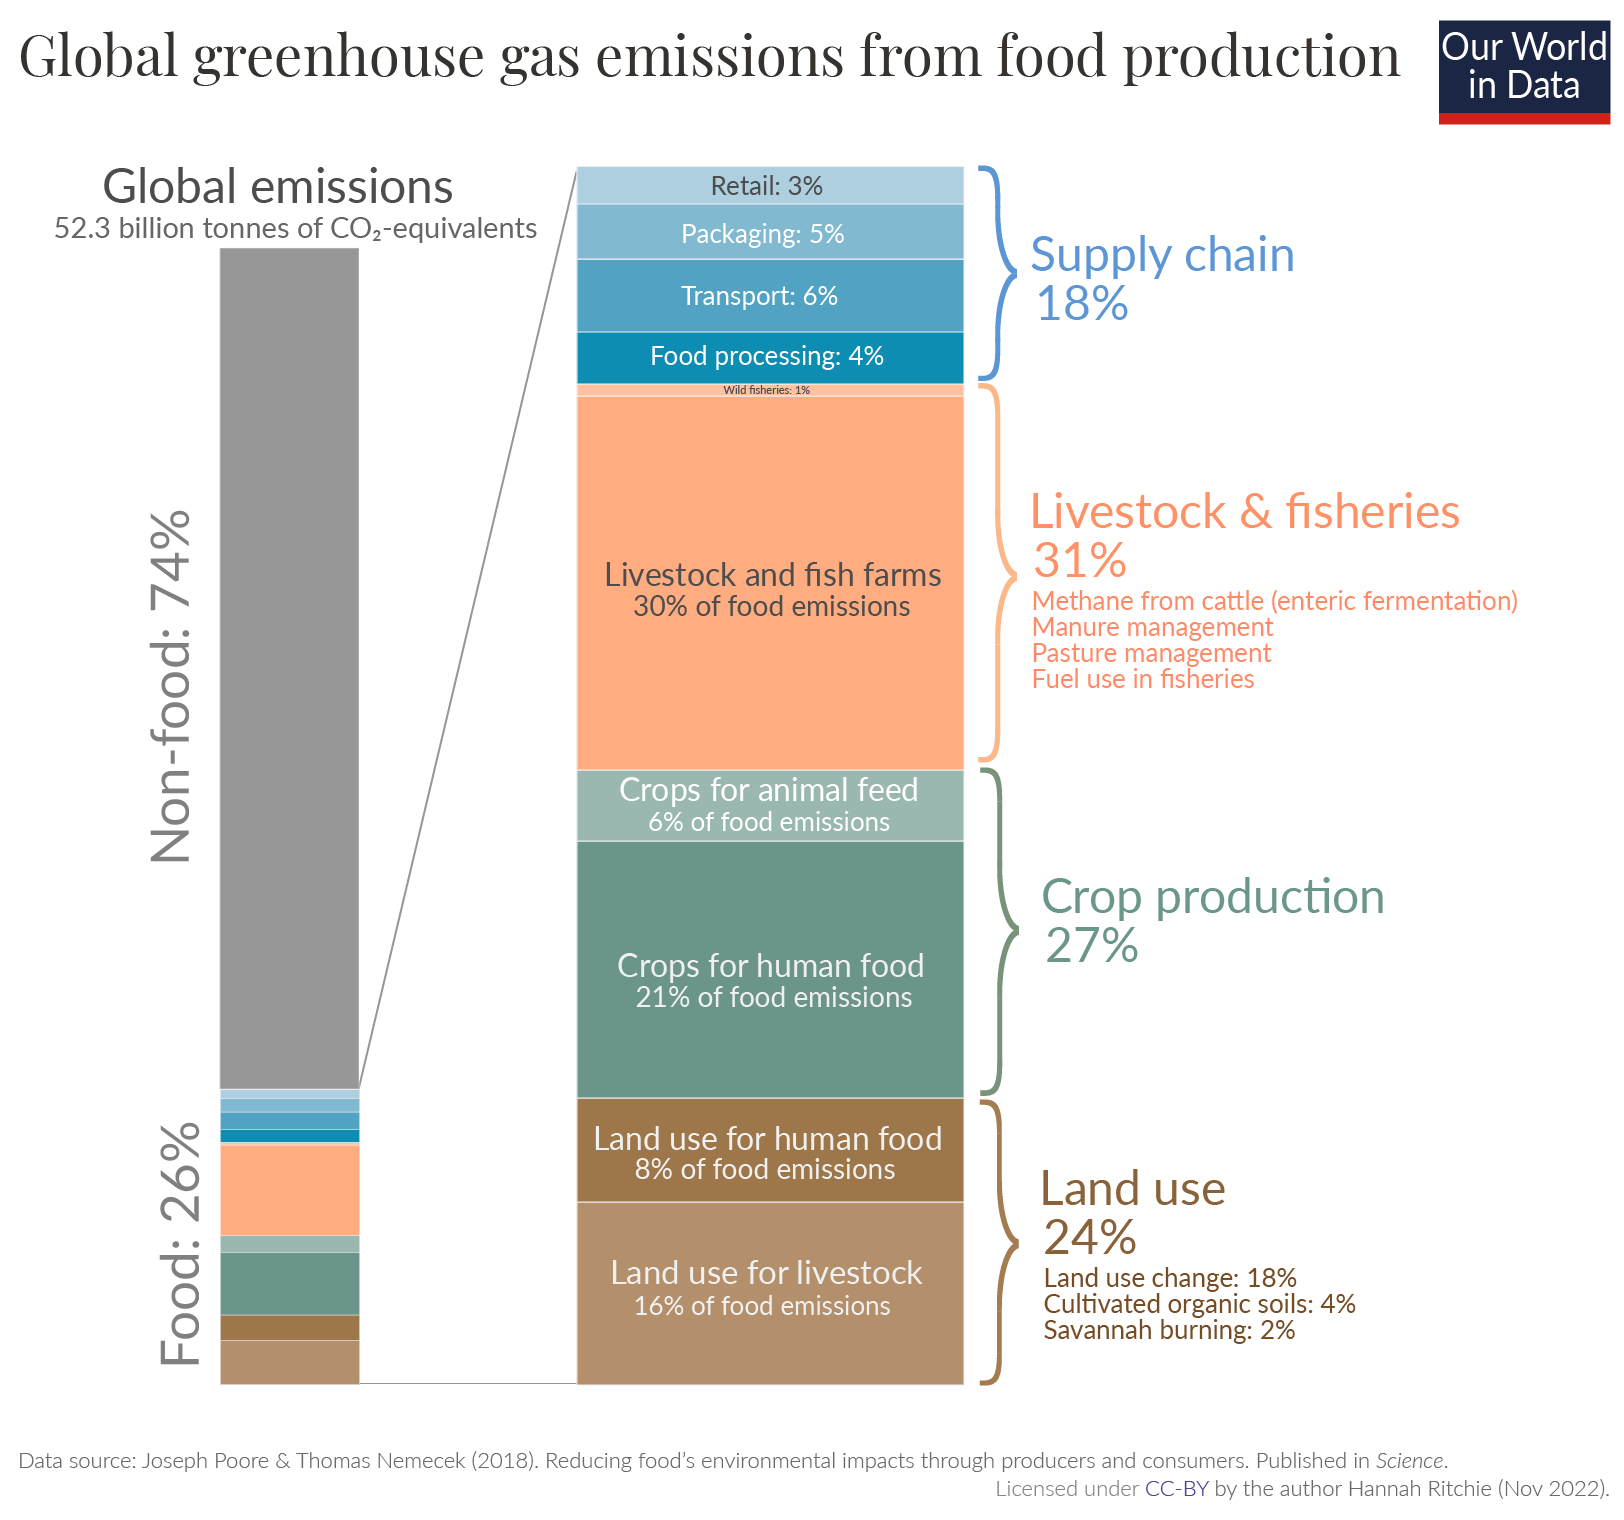
According to “Our World in Data” approximately 25% of the global greenhouse gas emissions arise from food production – which is not directly impacted by mechanical engineering or product development.

Green facts
How is the greenhouse gas split between countries?
The big picture - where does the main emissions arise from?
Source: https://www.climatewatchdata.org
China, United States, EU and India account for more than 50% of the worlds greenhouse gas emissions.
A look at the trend over time…
As countries industrialize, historically, CO2 emissions rise – meaning that a demand for green product design is a part of breaking this trend.
Learn more about CO2 and link to product development
What is the global material impact on greenhouse emissions?
From a mechanical engineering point of view, the effort in material substitution from CO2 heavy to CO2 light materials is interesting.
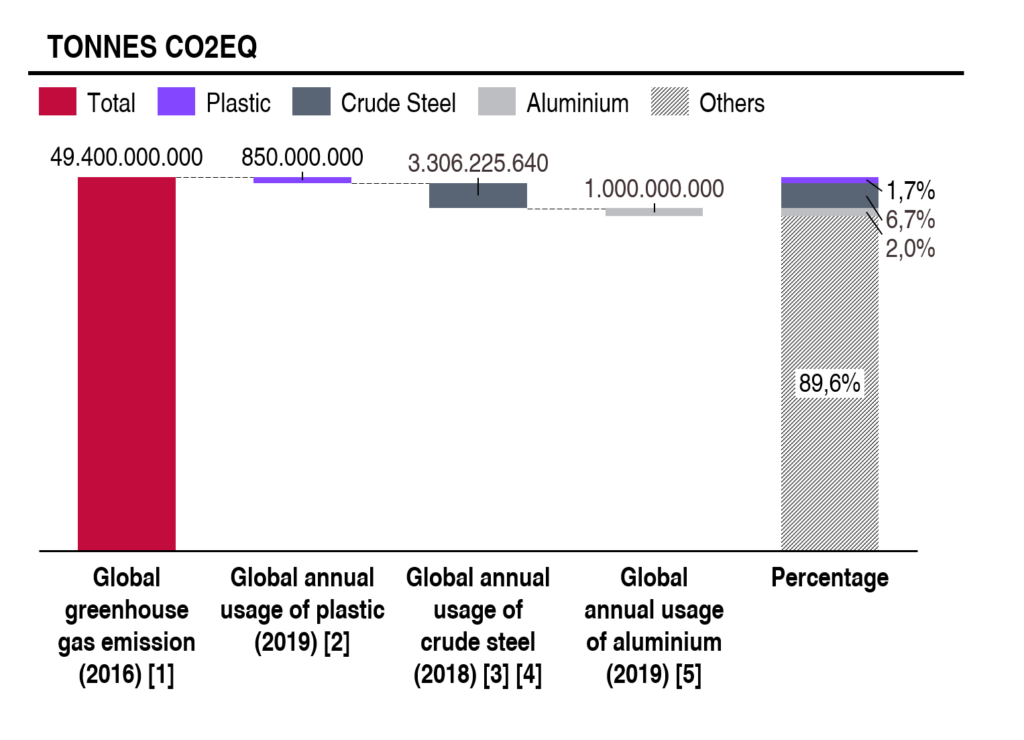
From the chart below (estimates by RD8) it is seen that:
- Plastics drive app. 2% of global CO2 emissions
- Crude steel drive app. 7% of global CO2 emissions
- Aluminium drive app. 2% of global CO2 emissions
Converting the annual production of these 3 material groups into CO2-neutral alternatives would drive an approximate 10% reduction in global CO2 emissions.

Sources:
[1]: [Source: Hannah Ritchie and Max Roser (2020) – “CO₂ and Greenhouse Gas Emissions”. Published online at OurWorldInData.org. Retrieved from: ‘https://ourworldindata.org/co2-and-other-greenhouse-gas-emissions’]
[2]: Source: Greenhouse gas emissions and natural capital implications of plastics, (including biobased plastics), Eionet Report – ETC/WMGE 2021/3 , European Topic Centre on Waste and Materials in a Green Economy, May 2021
[3]: https://www.worldsteel.org/steel-by-topic/sustainability/sustainability-indicators.html – 2018 data
[4]: https://www.worldsteel.org/steel-by-topic/statistics/annual-production-steel-data/P1_crude_steel_total_pub/CHN/IND – 2018 data
[5]: https://www.researchgate.net/publication/337430874_Aluminum_Production_in_the_Times_of_Climate_Change_The_Global_Challenge_to_Reduce_the_Carbon_Footprint_and_Prevent_Carbon_Leakage – November 2019


