Kinematics
Part-part design
Ideal kinematic interface design is the key to simplicity and complexity reduction.
Example: quantification of a mechanical interface
Before and after example of two parts (grey and green) are shown in a section cut to illustrate some mating features in the interfaces.
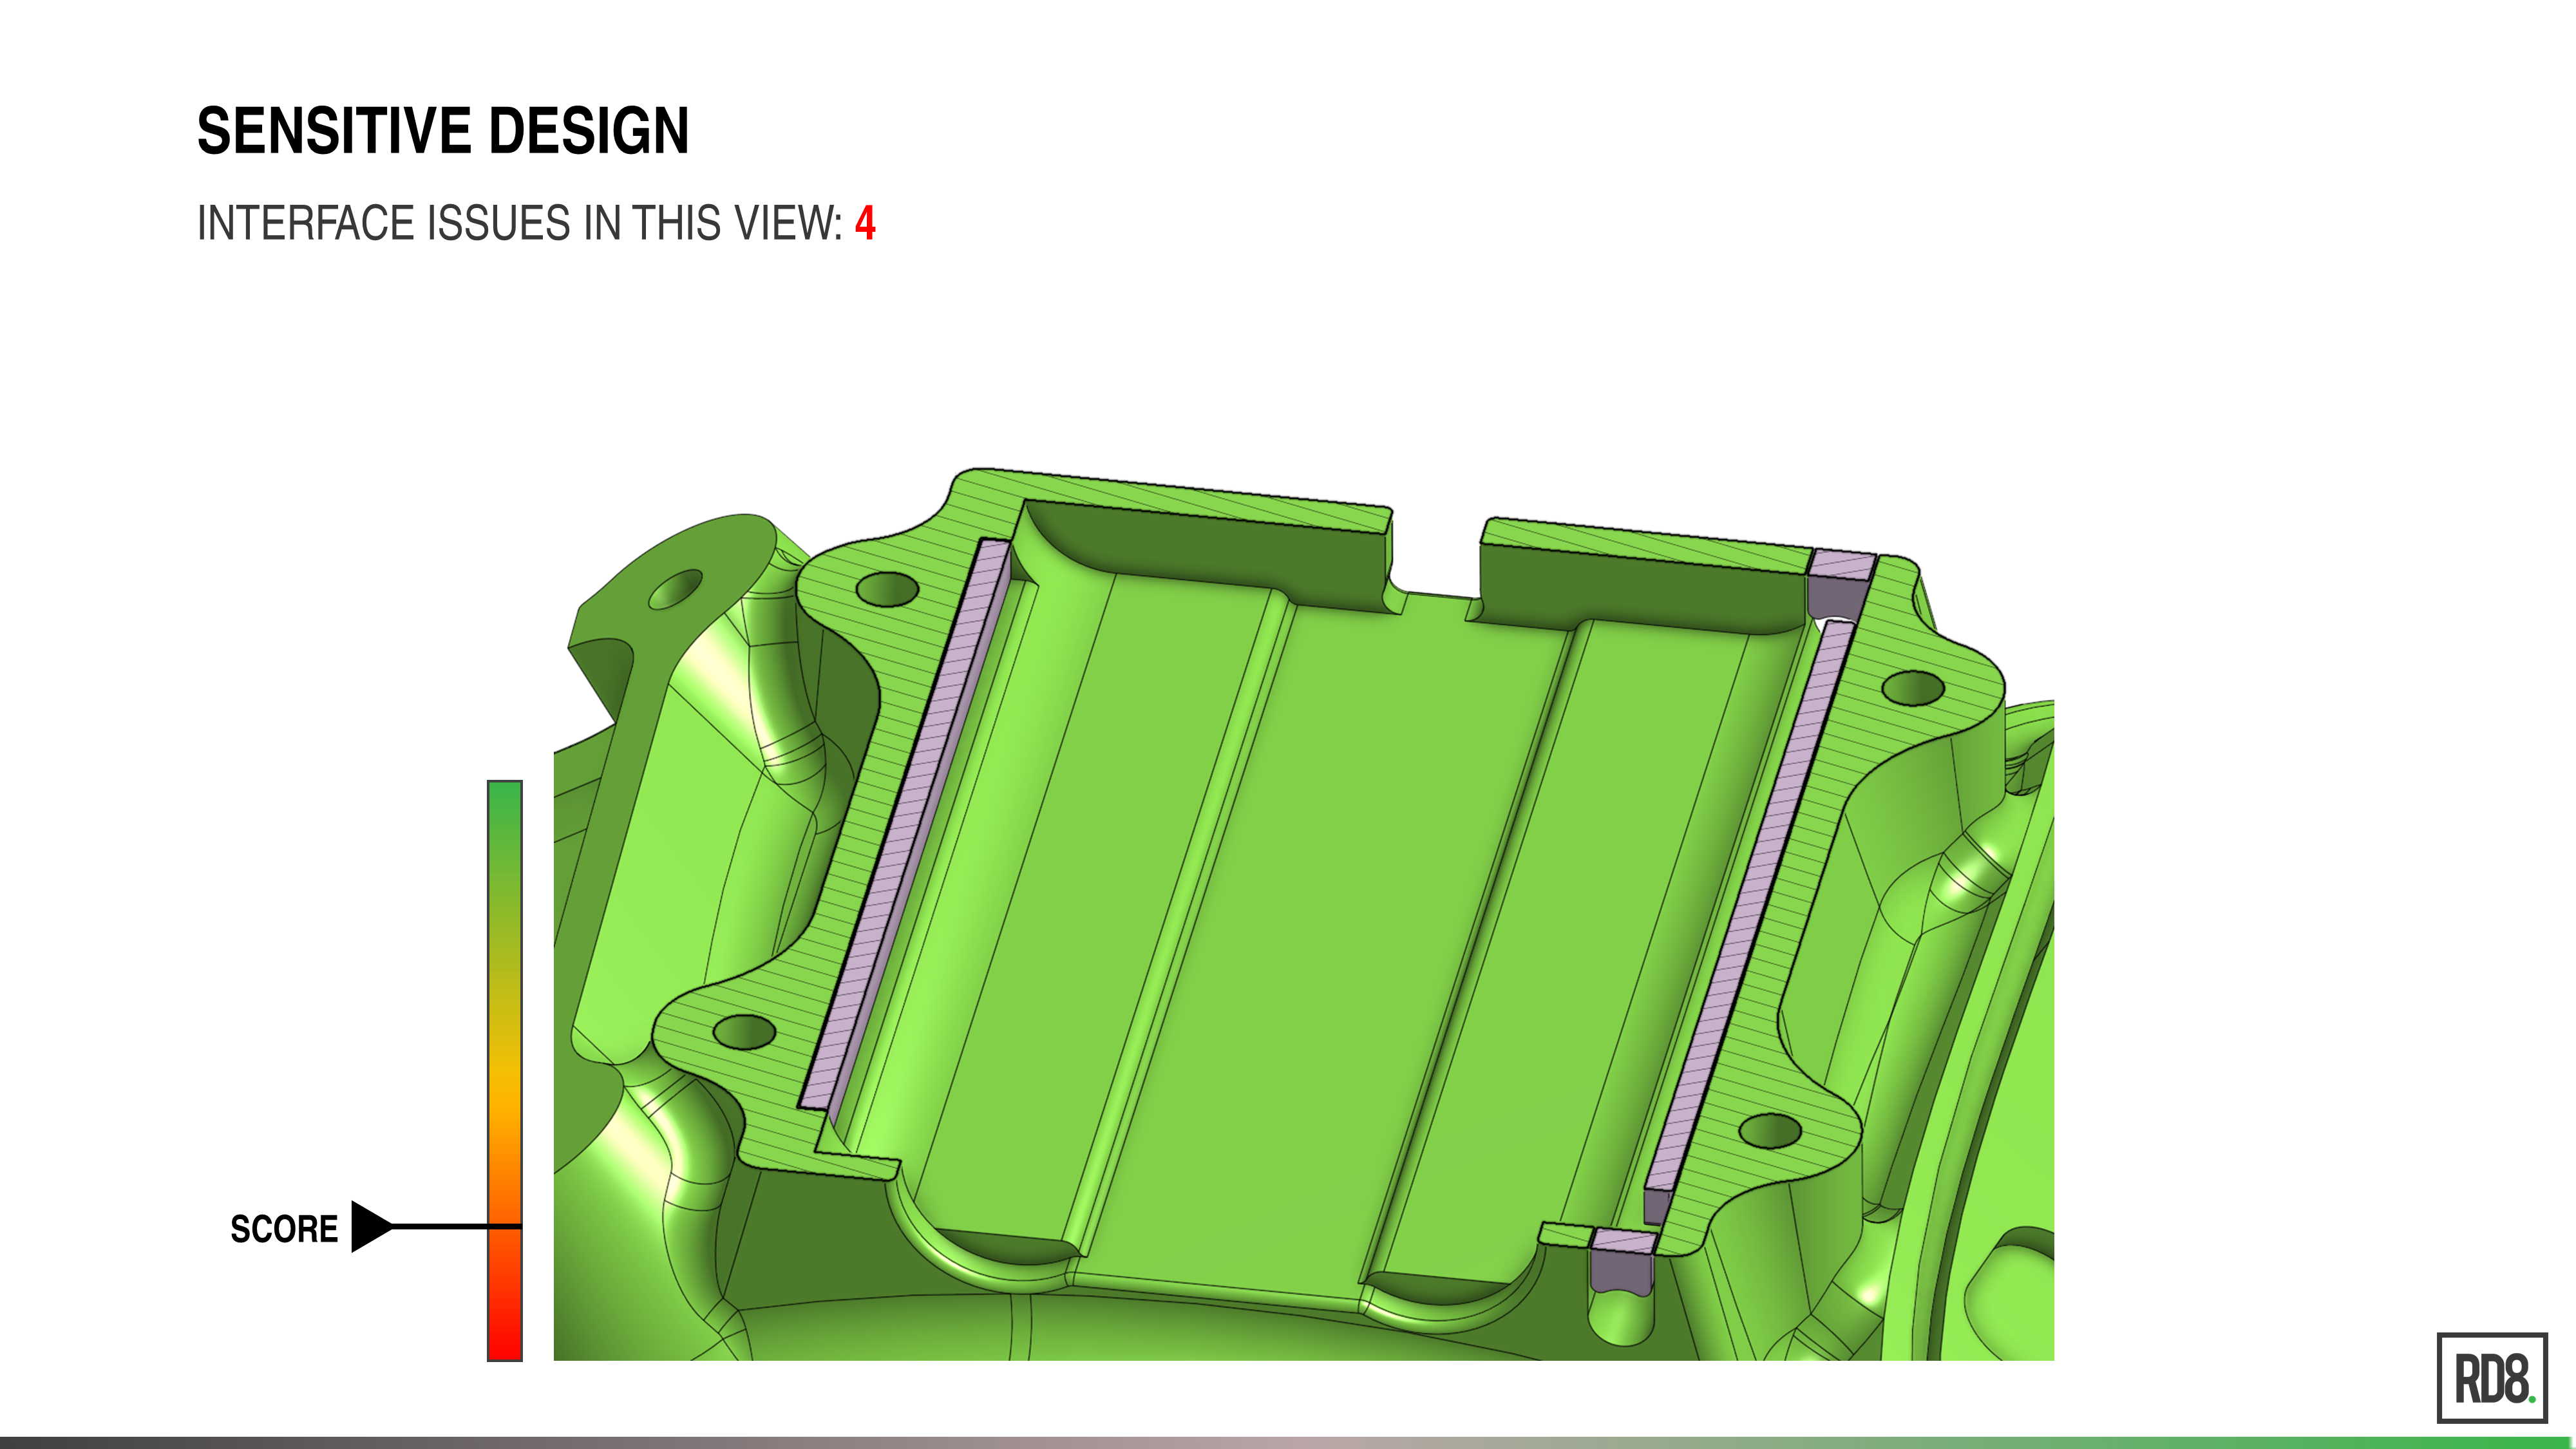
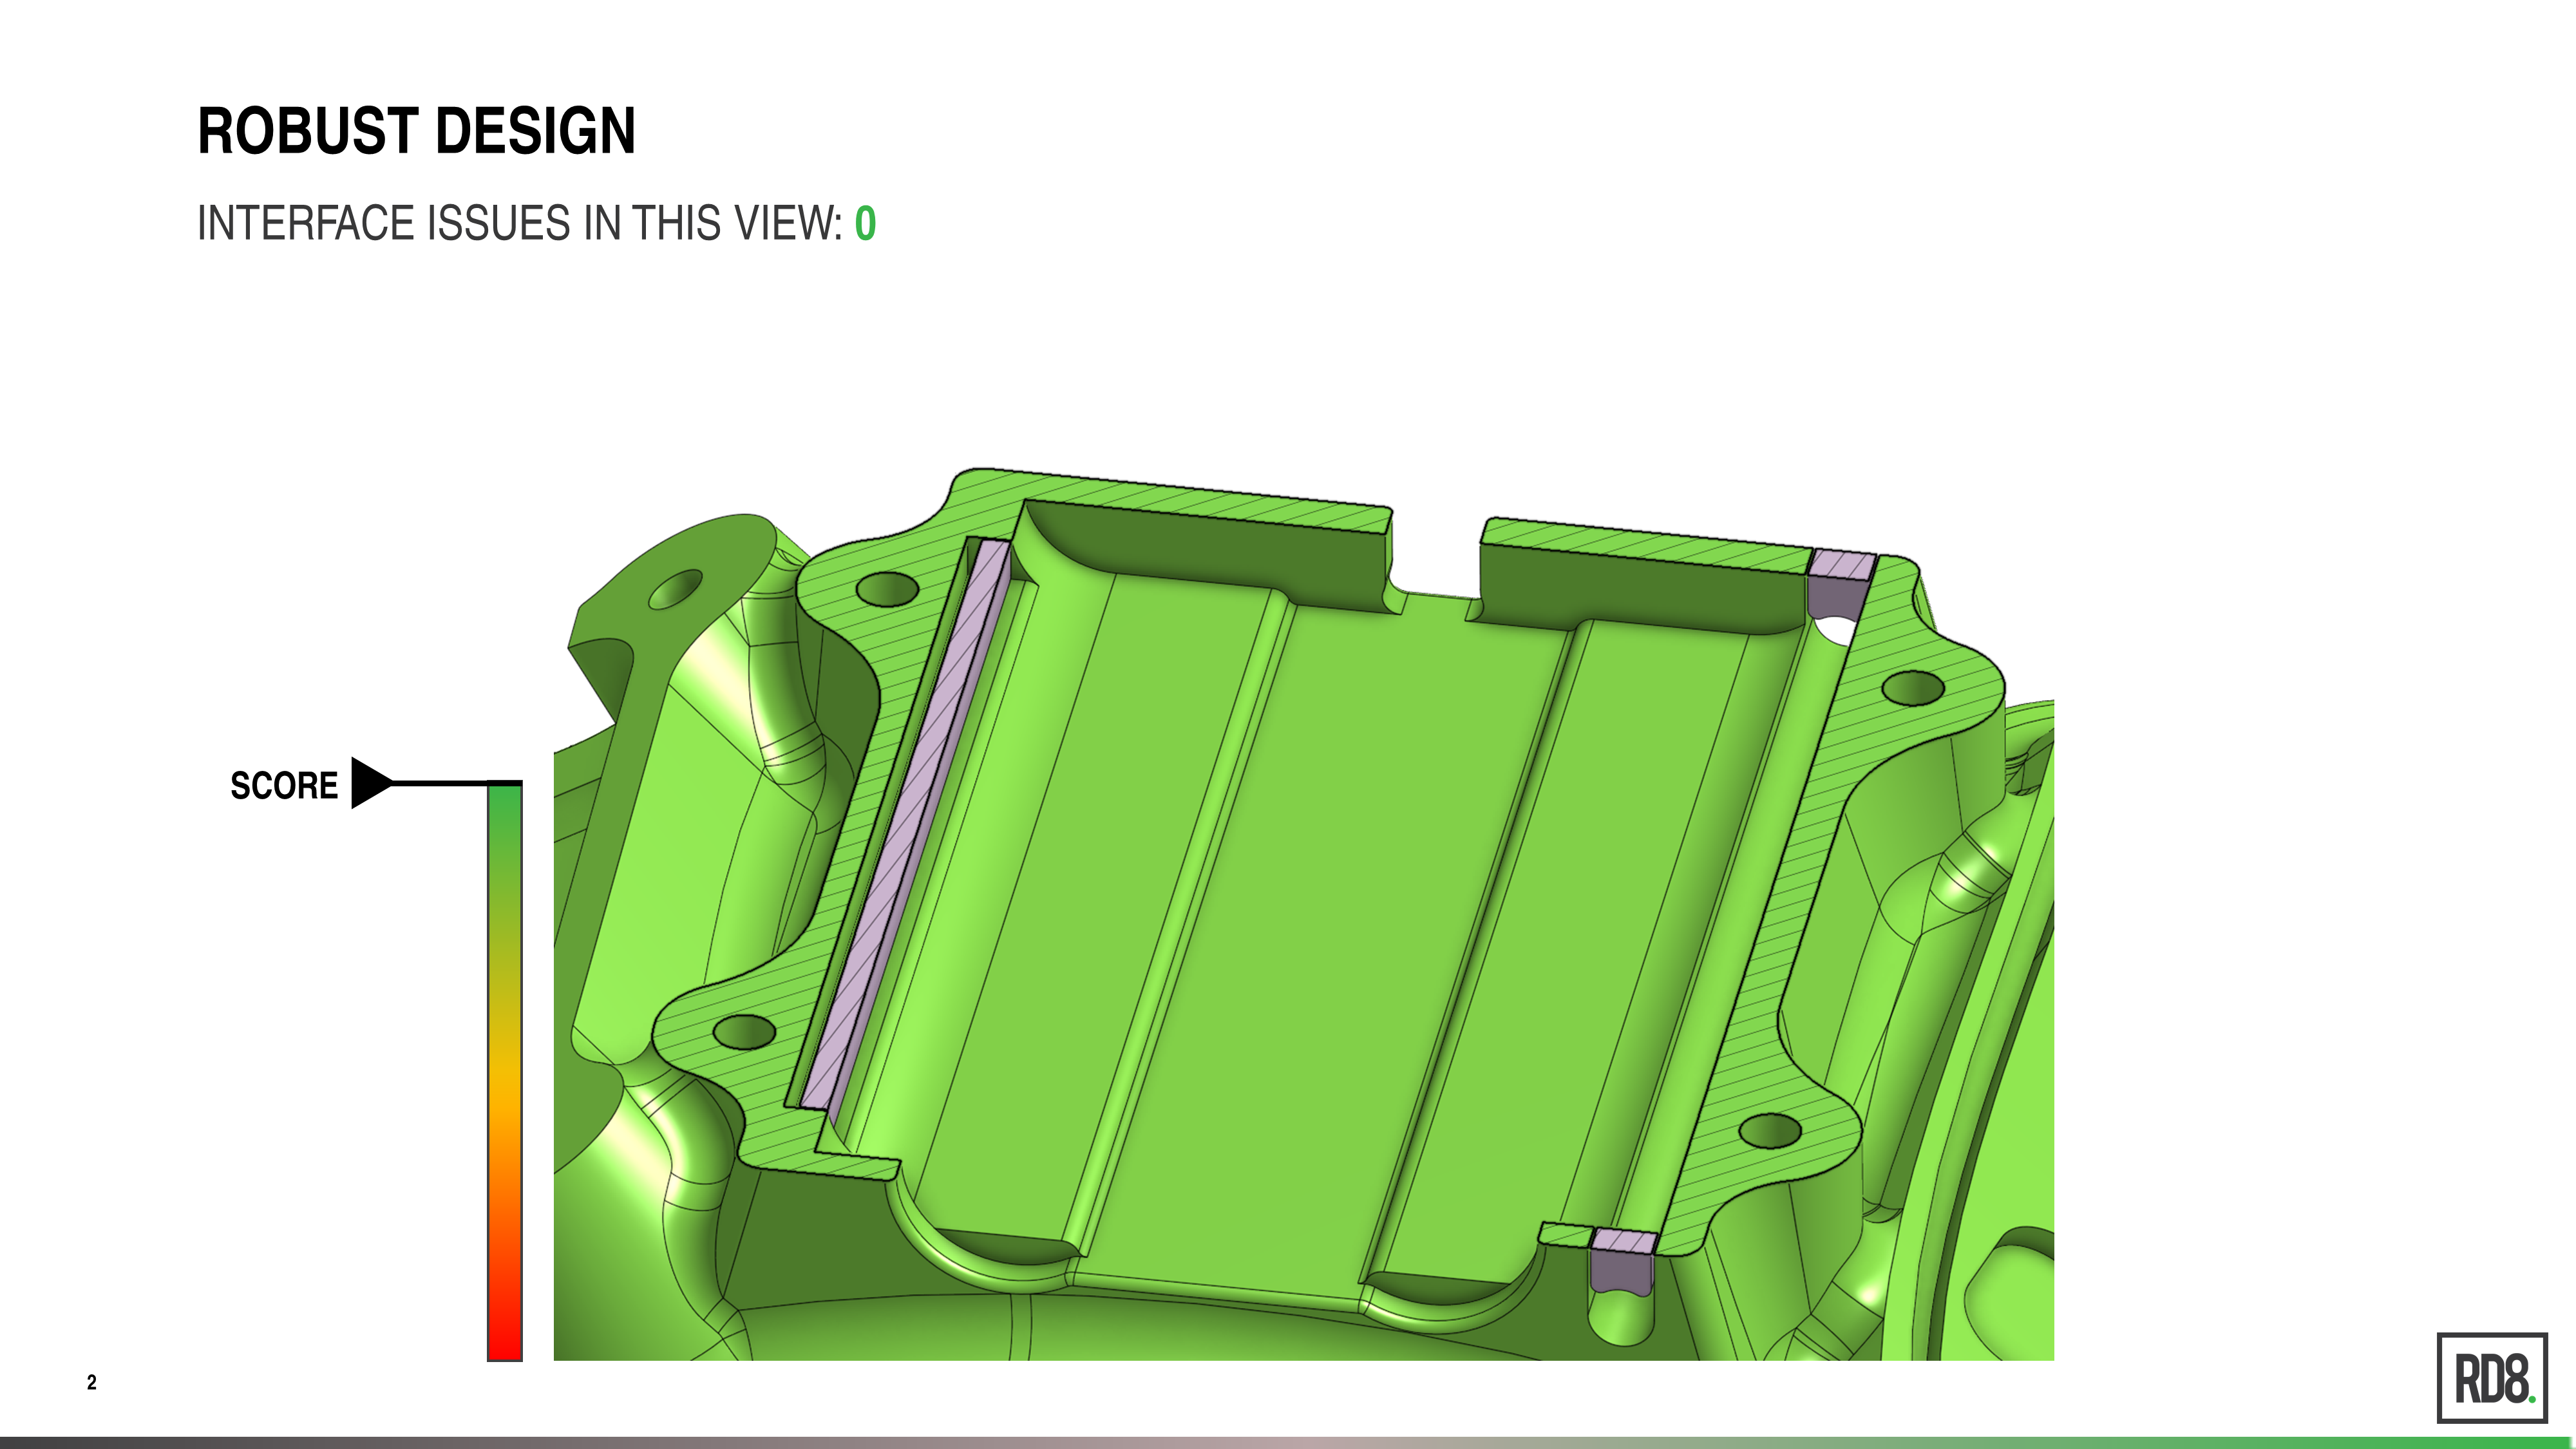
Move the slider to see the before (sensitive design) and after (Robust Design) example. The interface score for the first interface is 4 – meaning 4 additional and unnecessary geometry features that add complexity to the product. A score of 0 is ideal – the interface is in equilibrium – and has exactly the amount of information/constraints that it needs.
Product redesigning equals complexity reduction and cost reduction on products
To say it in a simple way: product redesigning will lead to a complexity reduction, which equals cost reduction on products.
Changing part production from one production process to another can reduce part cost, improve product performance, and reduce CO2 emissions.
Changing from one process to another often requires a lot of important considerations, including tolerances. It is because production processes have different production capabilities. The chart below shows International Tolerance Grade ranges for various production processes. A higher grade equals wider and more course tolerances.
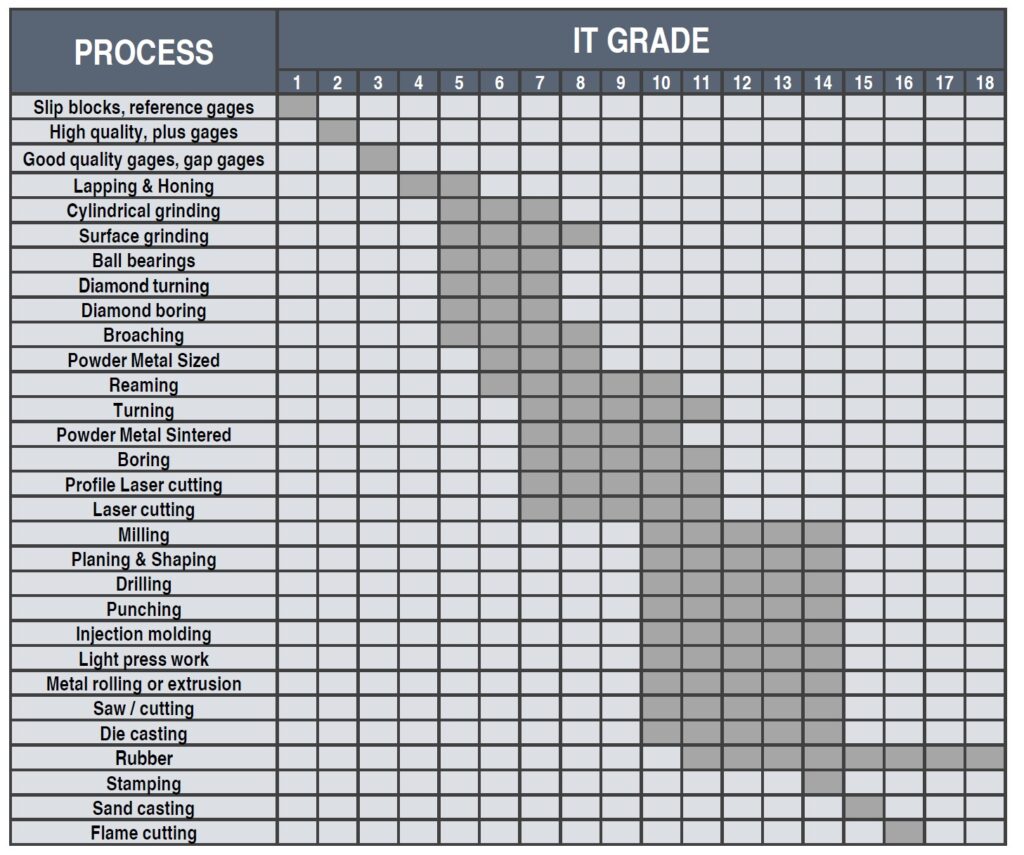
For example, going from reaming (IT6 to IT10) to drilling (IT10 to IT14) will result in expected wider tolerances and faster machining cost; hence lower part cost. The cost index between a reaming tool and a drilling tool is also in magnitude of factor 10.
Robust design of components can enable more course production processes that are often cheaper and more energy/CO2 efficient.
Product redesign with Robust Design achieved +60% reduction of part requirements in an interface between two parts
Most interfaces in a mechanical product are not optimized to a low RD8 index score. The result hereof is that one will need to over-specify the components to handle the complexity. This often reflects in additional measures on a part and/or 2D drawing. The example below will illustrate and indicate the needed measures on a "standard design" and a "Robust Design" and highlight the difference between them. It is seen that a +60% reduction in the number of measures in this simple example.
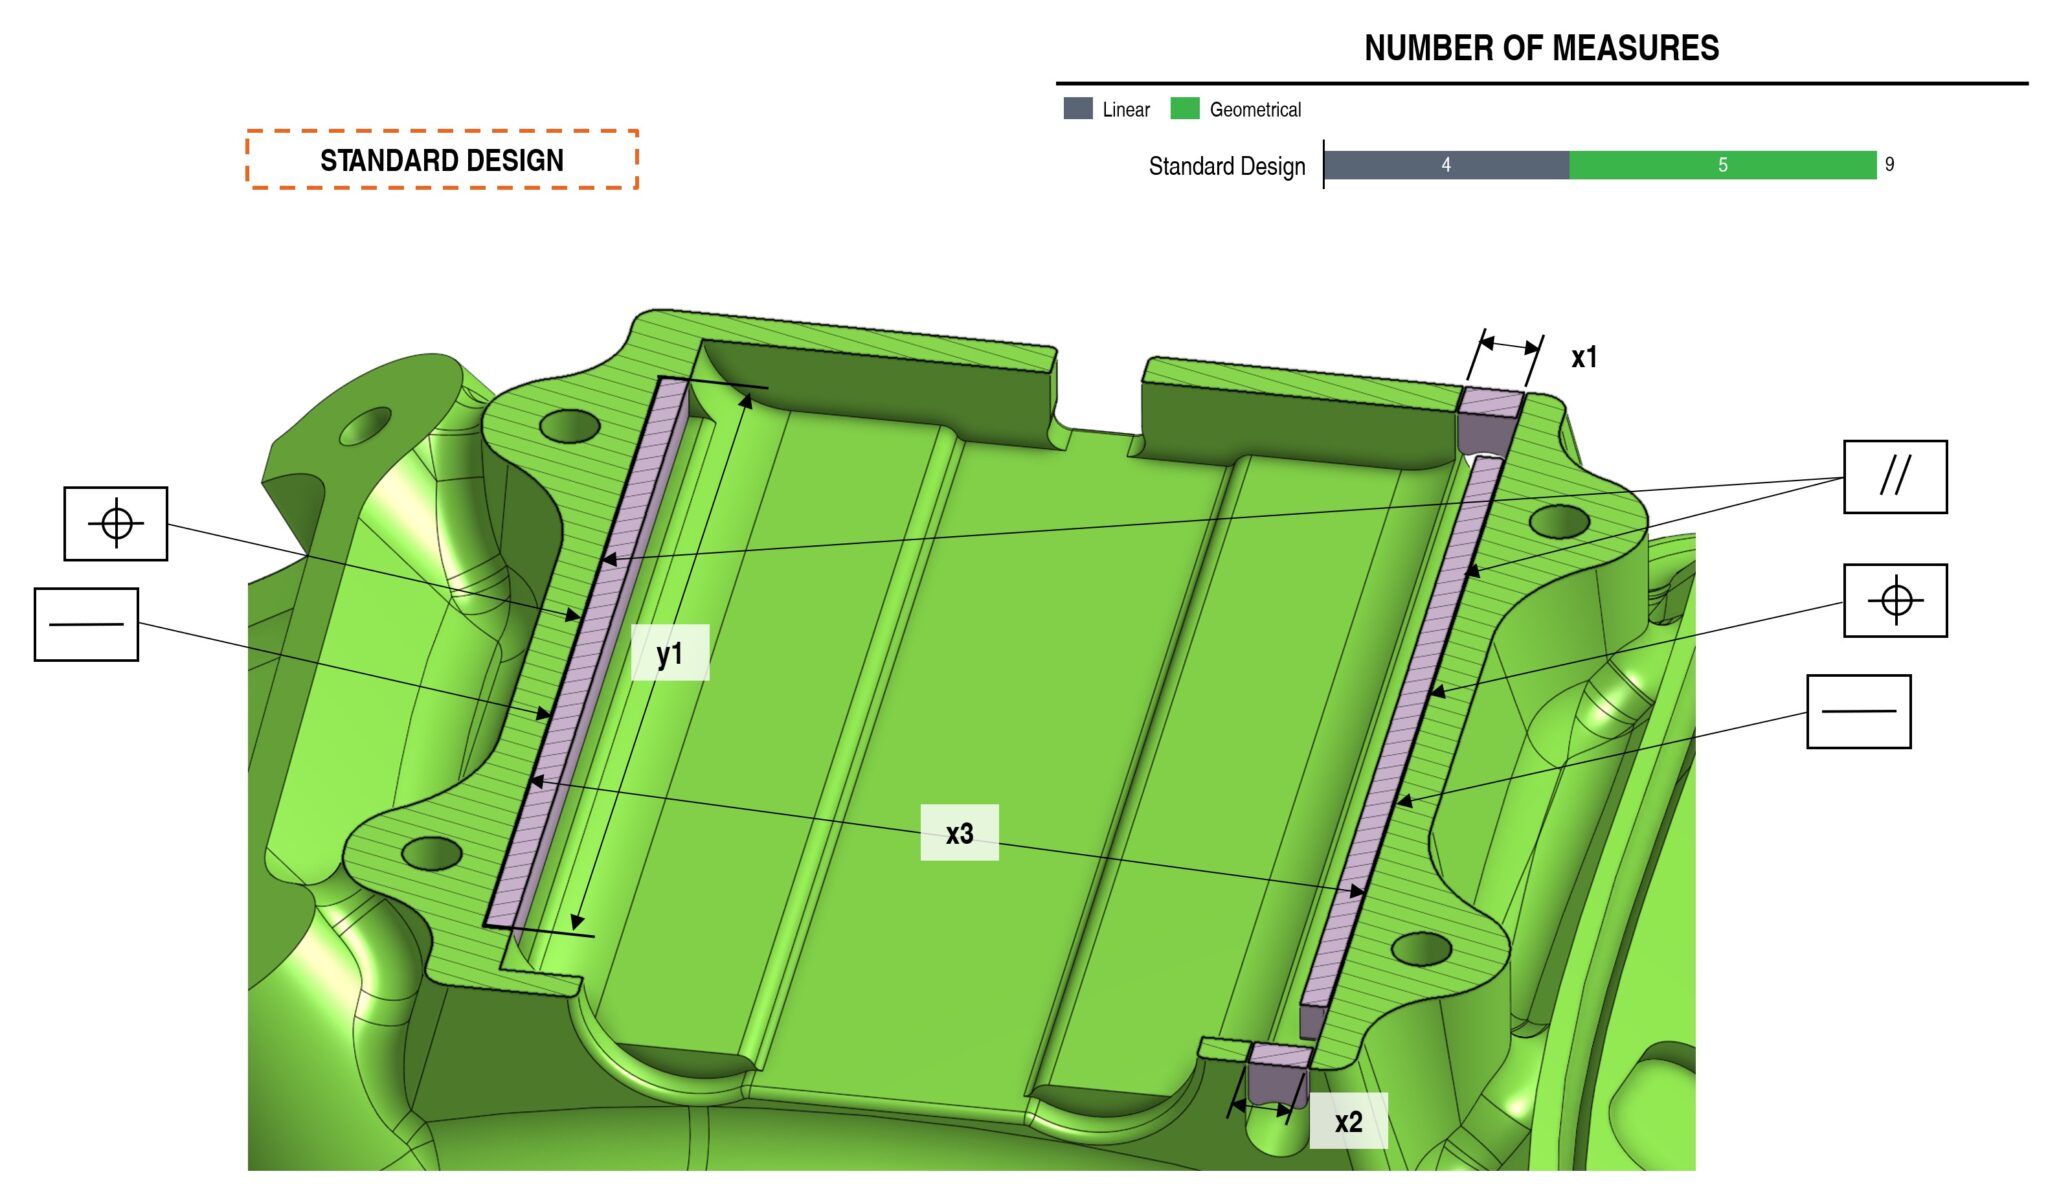
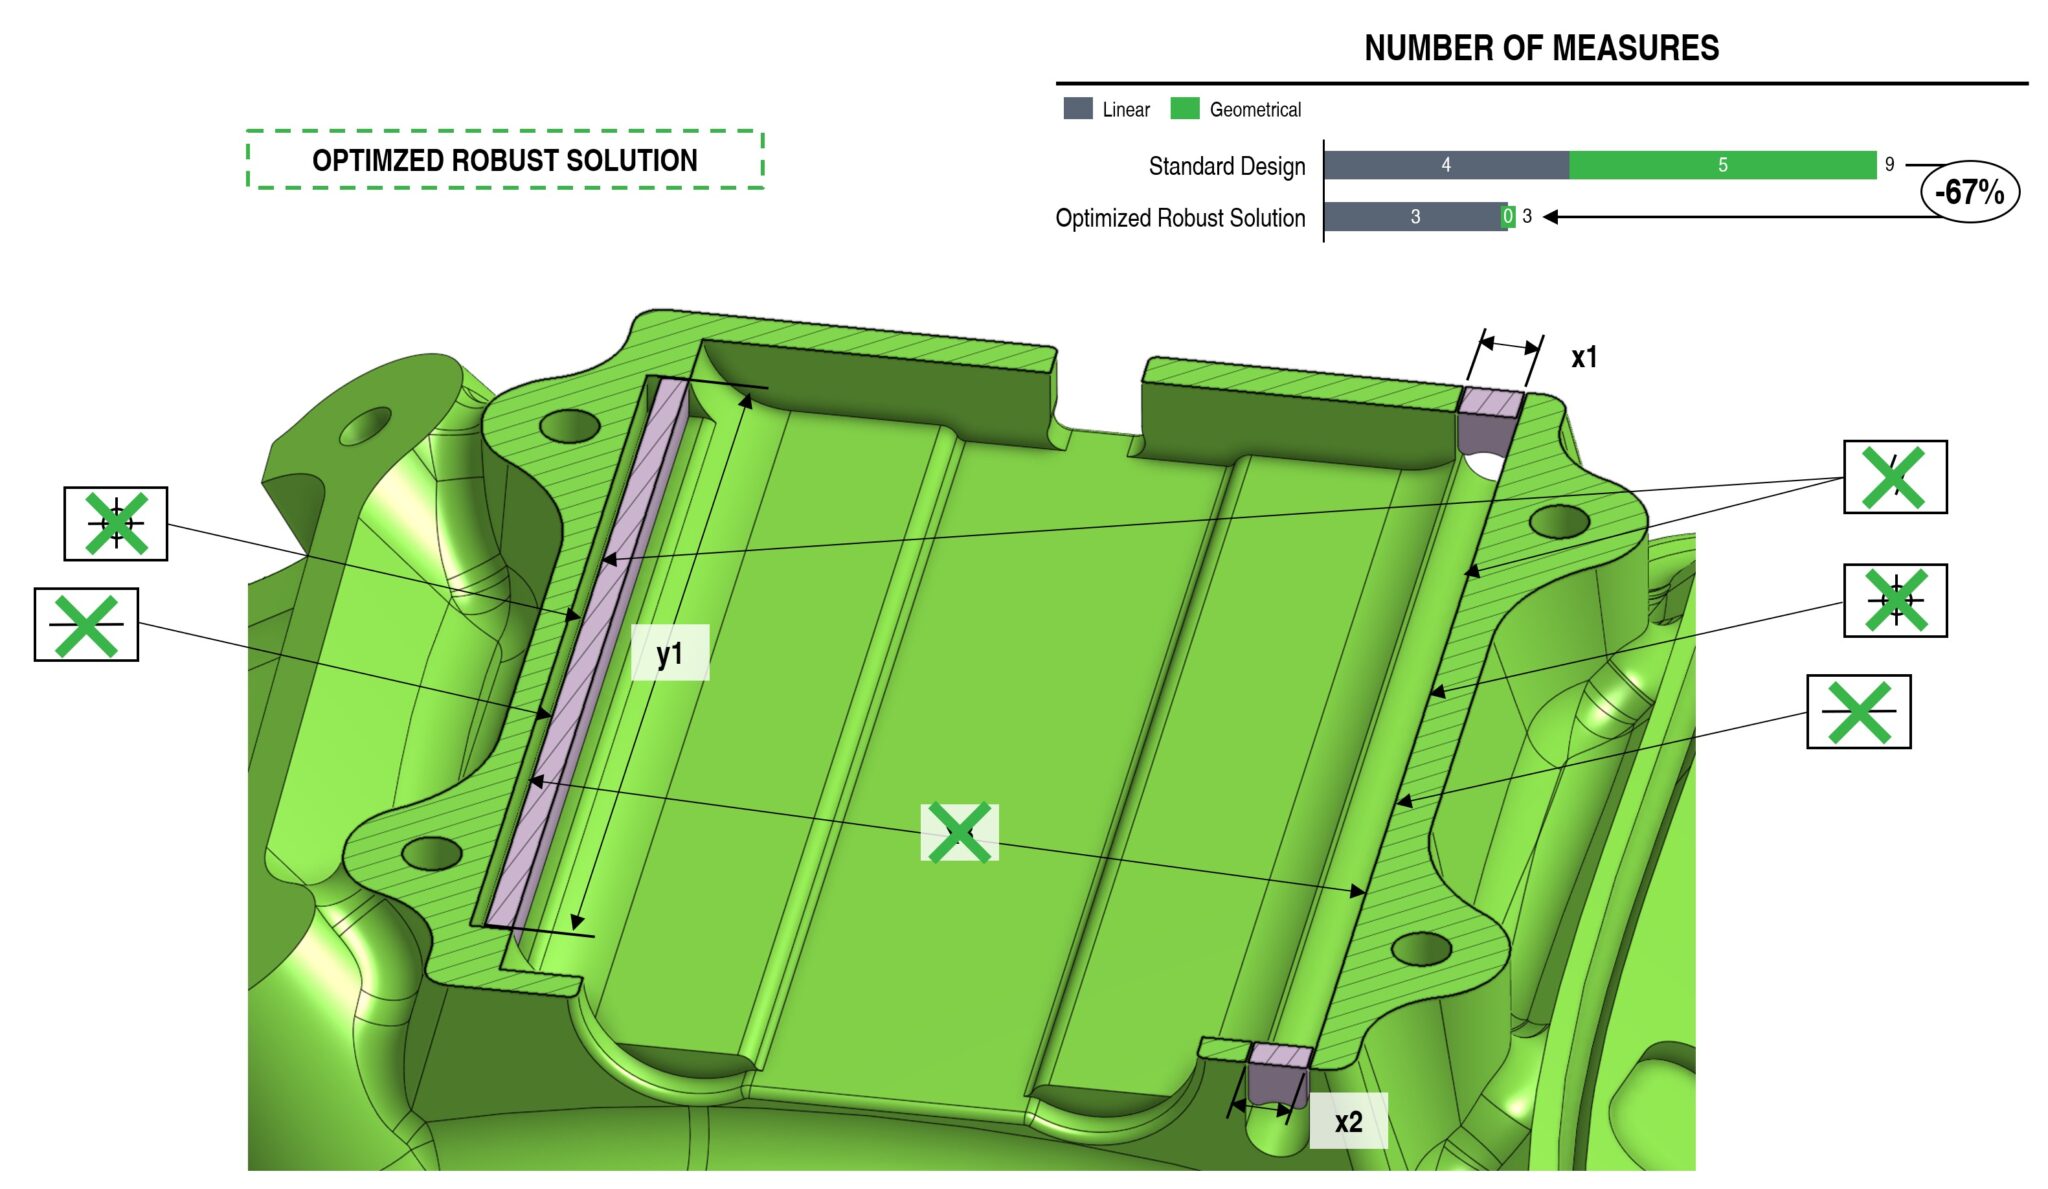
The example above shows a “standard design” and an “optimized robust solution”. Linear and geometrical tolerances are indicated in illustrations (in practice, the measures should be shown on both parts – through the percent-wise evaluation will be the same.
Standard design
- Three measures in the x-direction
- One measure in the y-direction
- Requirements to parallelism for the two ribs and their counterfits
- Position requirements ribs placement relative to “x1” and “x2” features
- Straightness requirements to ribs and counterparts
Optimized robust solution
- Two measures in the x-direction
- One measure in the y-direction
- Requirements to parallelism for the two ribs and their counterfits
- Position requirements ribs placement relative to “x1” and “x2” features
- Straightness requirements to ribs and counterparts
Reduction of measures is a crucial driver for wider tolerances and enables changing the production process to less costly processes, and reduces the requirements for expensive QA.
The downstream effects of less complexity are a true driver for cost reductions on the total cost of the product with effects on development time, testing, sourcing, production, assembly & inspection.
Onshape tutorial
Challenge
One interface - many solutions: One good, one bad, and many in between. Choose the right one!
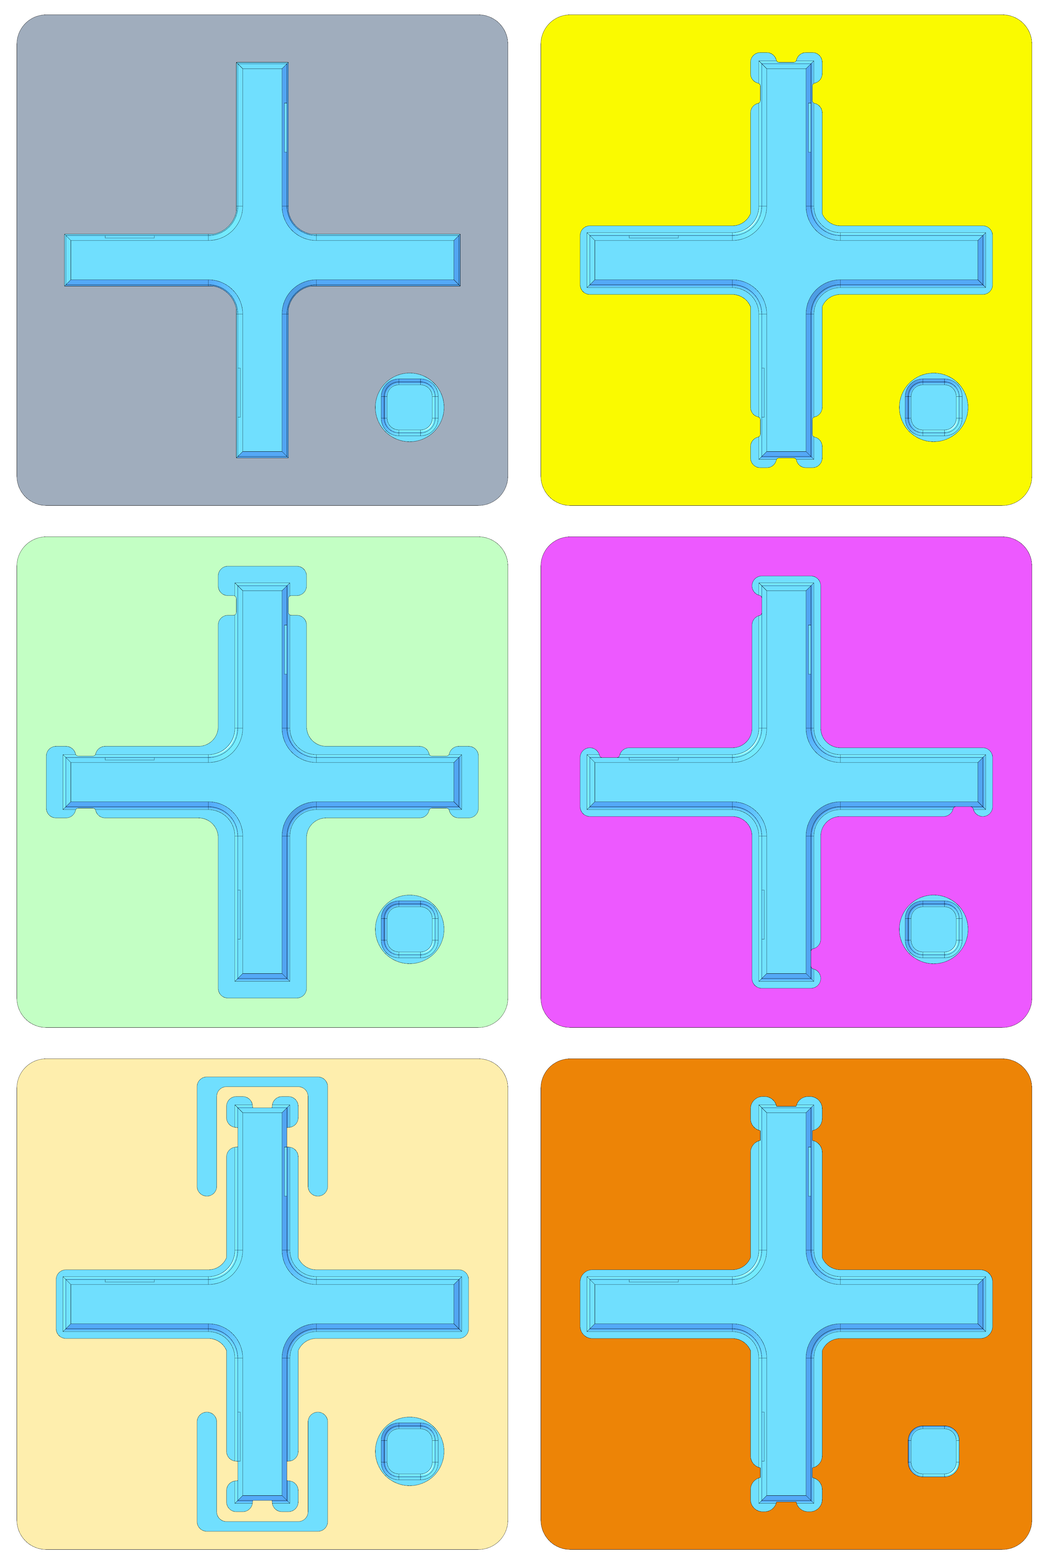
Different examples of part-part interfaces – learn how place constraints ideally in our talent development programs.


