
What is a design metric?
A design metric is a way to objectively evaluate a design. Design metrics can be used to compare and evaluate products and different concepts - to assess the maturity of design and to define the condition of a design - if it is good or bad.
RD8 specializes in design metrics within robust design. The metrics are aimed to assess design information (concept sketches, product specification, 3D CAD, 2D drawings) before they are handed over to manufacturing.
Typical uses for Robust Design metrics.
- Benchmarking – comparing and evaluation of products and concepts
- Project gates – used as evaluation criteria for project gates
- Value Engineering – Identification of product and concept potentials
- BIG data – Linking design metrics with business and production performance
Design metrics within Robust Design - based on 8 disciplines
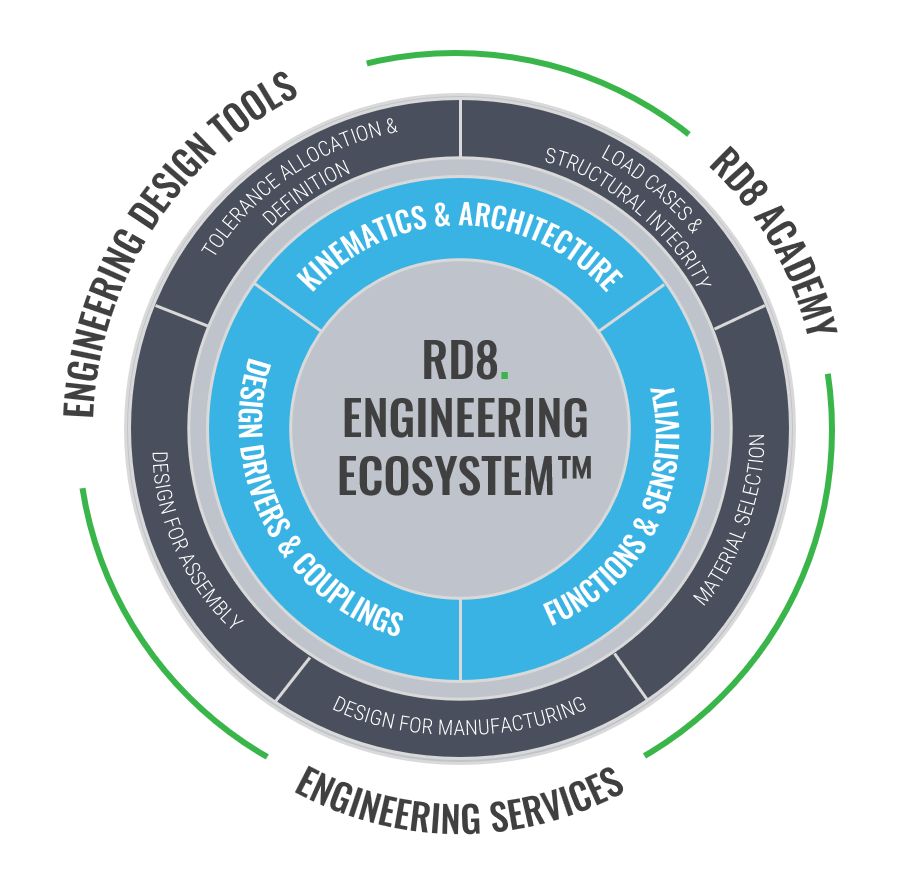
Kinematics – The foundation. Kinematic design on the system and detailed level. Metrics for product architecture, mechanism design, and mechanical interface design in the detail.
Functions – Product function is vital! Ensure healthy concepts with low sensitivity – high robustness.
Couplings – Reduce complexity! Remove dependencies by decoupling.
Tolerances – Ensure short tolerance chains and feasible tolerances (to match process capabilities)
Structure – Ensuring match between requirements, function, cost, and mechanical properties.
Materials – Ensure the right selection of materials – their complexity and link to adjacent components.
DFM – Ensure optimized manufacturability of parts
DFA – Ensure ease of assembly and link to product design
Data-driven product development
Unique Metrics for robustness. RD8 offers a unique metric to score the mechanical design of a product (the robustness of the design).
The metrics are leading indicators (not lagging/retrospective) and are used to guide the design process towards ideal robustness the first time. A low score reflects a robust design. A high score reflects a complex and sensitive system. If a product is brought from a high to a lower score a potential within the topics can be released:
Data-driven product development is key for value engineering these days. The ability to link the value of product design to cost, performance, and quality is key for radical product updates. Examples of potentials for applying Robust Design – that can be quantified through design metrics.
Ideal state for each metric is “0”.
High numbers indicate non-optimized areas.
To achieve the full value of value engineering – maximize price, minimize cost – leaders can use the metrics for design guidance to ensure that ideal value engineering has been performed on the product.
How to work with design metrics
Leading indicators & lagging indicators
The Robust Design metrics are based on the philosophy of leading indicators.
The metrics are used to measure design information (3D CAD, 2D drawings, basic concept, …, all data that is being generated to manufacture a product) on an objective basis. Typically design metrics are lagging indicators – e.g. number of customer complaints, scrap rate, etc. which is arising after a product is launched. The Robust Design metrics are unique in the way that they help ensure project success before the design is released.
Daily use of Robust Design metrics
On daily basis the Robust Design metrics are used to track product development – each development project can be evaluated by the 8 Robust Design metrics/disciplines – and scores can be aggregated to a traffic light scheme (green = in control, yellow = medium, red = complex) for each project.
Detailed drill-downs for each project are used to track progress, set direction, and communicate a quality level of design information.
The design metrics are typically integrated into development processes and used for gate reviews.
The Robust Design metrics can be used from the planning/concept stage of a project and all the way into production/mass production and sales.
The RD8 goal is to – at any time of the product development process – quantify the robustness of the given development project – a measure of the condition of the mechanical design.
Learn more about how to integrate the Robust Design metrics into the development process by a robust engineering system with RD8 Consulting.
The metrics are typically used for project gates, to monitor a project portfolio and track development projects.
Benefits of being in control of Robust Design metrics
By systematically improving the design – and hence improving the design metrics – developers free up a lot of potentials that can be used as an important asset in value engineering. E.g. lowering the carbon footprint of a given product, increasing quality while shortening delivery time, reducing cost, or raising the bar for product features.
Sustainable solutions
- Change of material towards a sustainable solution(e.g. virgin plastic to recycled plastic)
- Reduction of material use (less over-engineering)
- Reduction of scrap
- Design for reuse/circularity/recycling/disassembly
- Higher product efficiency (less energy/CO2 consumption)
- Increase product lifetime
Simpler
- Enablement of faster machining times/cycle times
- Enablement of low-cost suppliers
- Reduction of customer complaints/returns
- Reduction of material cost (material type and amount)
Faster
- Reduction of development time
- Reduction of change requests
- Reduction of tooling iteration
- Enablement of faster assembly times/automation levels
Smarter
- Enable less weight
- Enable longer product lifetimes
- Enable better energy efficiency
- Enable better visual appearances
- Enable better seals/IP rating