30% reduction of CO2 emission by material substitution to green alternatives
We have gathered some of the latest information in the field of CO2 reductions by material substitution. Substitution of virgin materials to recycled or biobased alternatives. E.g. one of the latest reports from May 2021 shows that CO2 emissions drop by 30% by changing a fossil-based value chain to a biobased plastics (See: “Greenhouse gas emissions and natural capital implications of plastics (including biobased plastics)”; May 2021; European Topic Centre on Waste and Materials in a Green Economy)
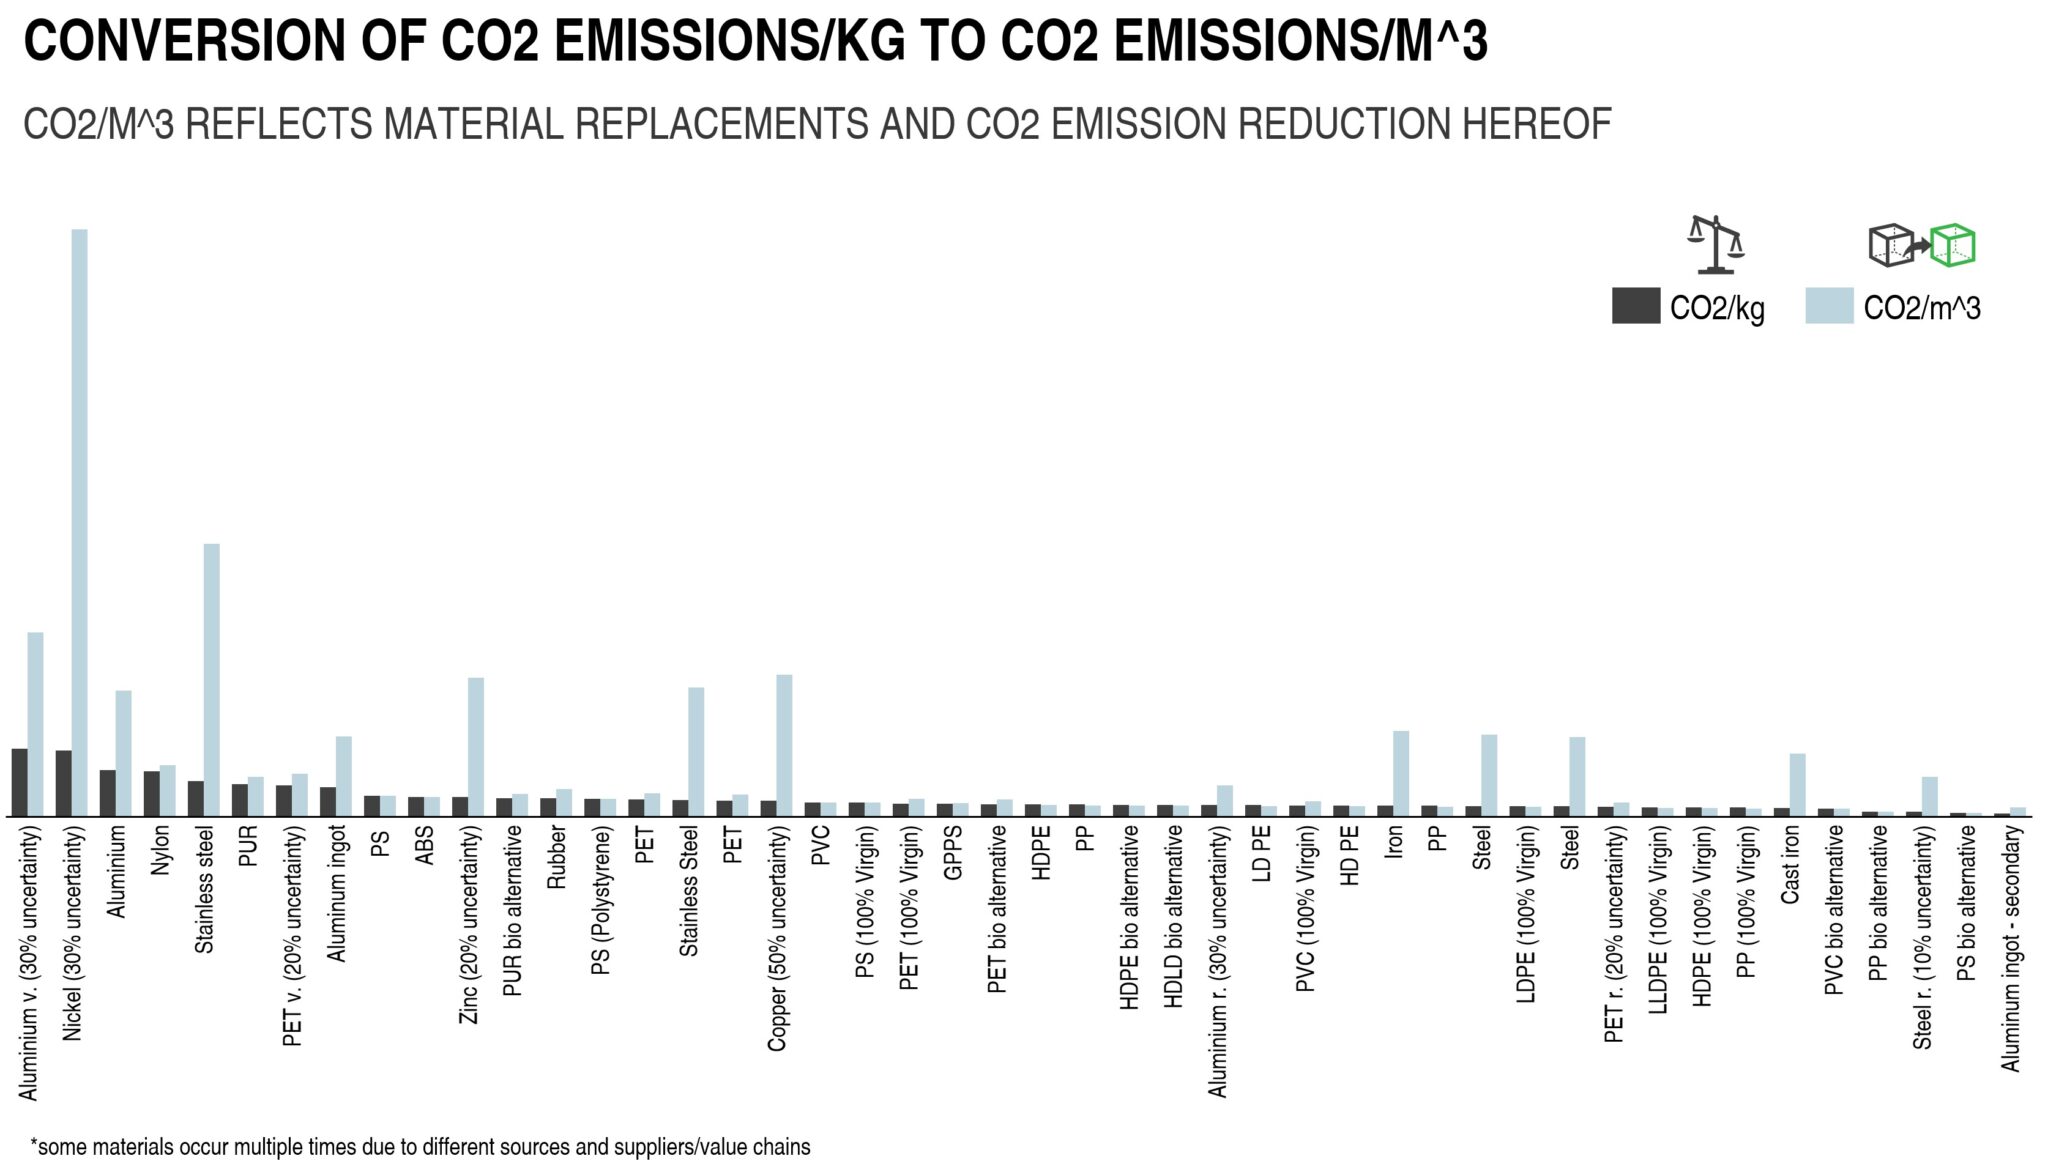
Conversion of CO2 emissions/kg to CO2 emissions/m^3
CO2/m^3 reflects material replacements and CO2 emission reduction hereof.

When looking up CO2 emissions per kg of material, e.g., Nylon and aluminum look alike (have similar values), but aluminum is far denser than nylon; hence replacing a volume of aluminum with a volume of nylon is actually CO2 friendly.
By looking at the various materials and their CO2 emissions/kg, the difference between them is minimal. However, comparing the materials’ CO2/m^3 emission it states that the emission per volume is much higher than the emission per kg.
By evaluation of the desired product part characteristics the material selection can be optimized for CO2 – e.g., strength per CO2 emissions equivalent or stiffness per CO2 emissions equivalent.
To make it easy or for an initial screening CO2 emissions/kg is converted to CO2 emissions/m^3. This indication if one product part of a given physical size is replaced by an equivalent sized part of a different material – what would the CO2 emission reduction or increase then be?
Green Facts
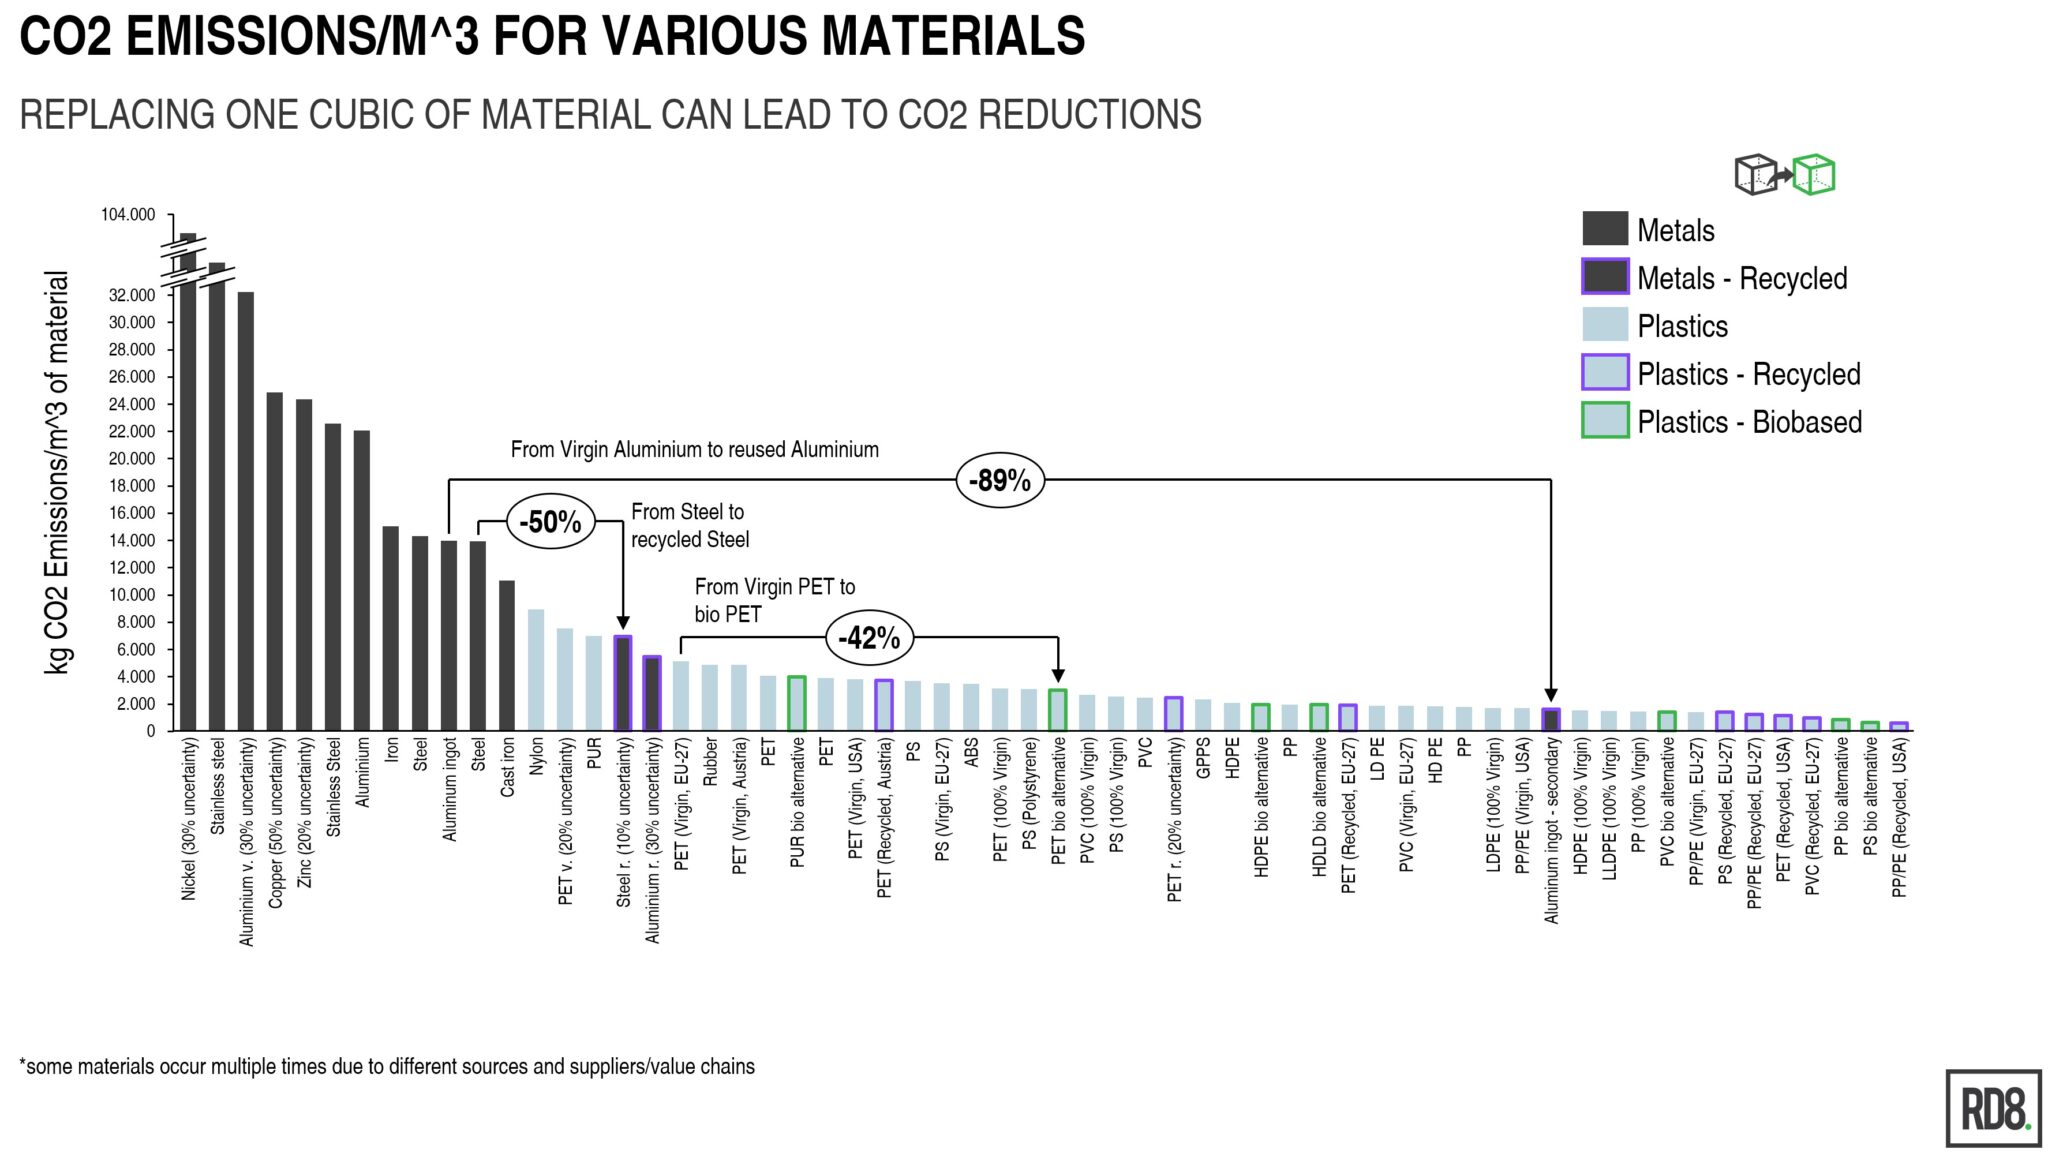
CO2 emissions/m^3 for various materials grouped into categories: virgin, recycled and biobased

Replacing one cubic of material can lead to CO2 reductions. For example, going from stainless steel to steel can reduce CO2 emissions by about 70%, and going from virgin aluminum to reused aluminum reduces the CO2 emission by 89%.
The two examples indicate that there is a huge potential in reducing CO2 by changing to greener alternative materials.
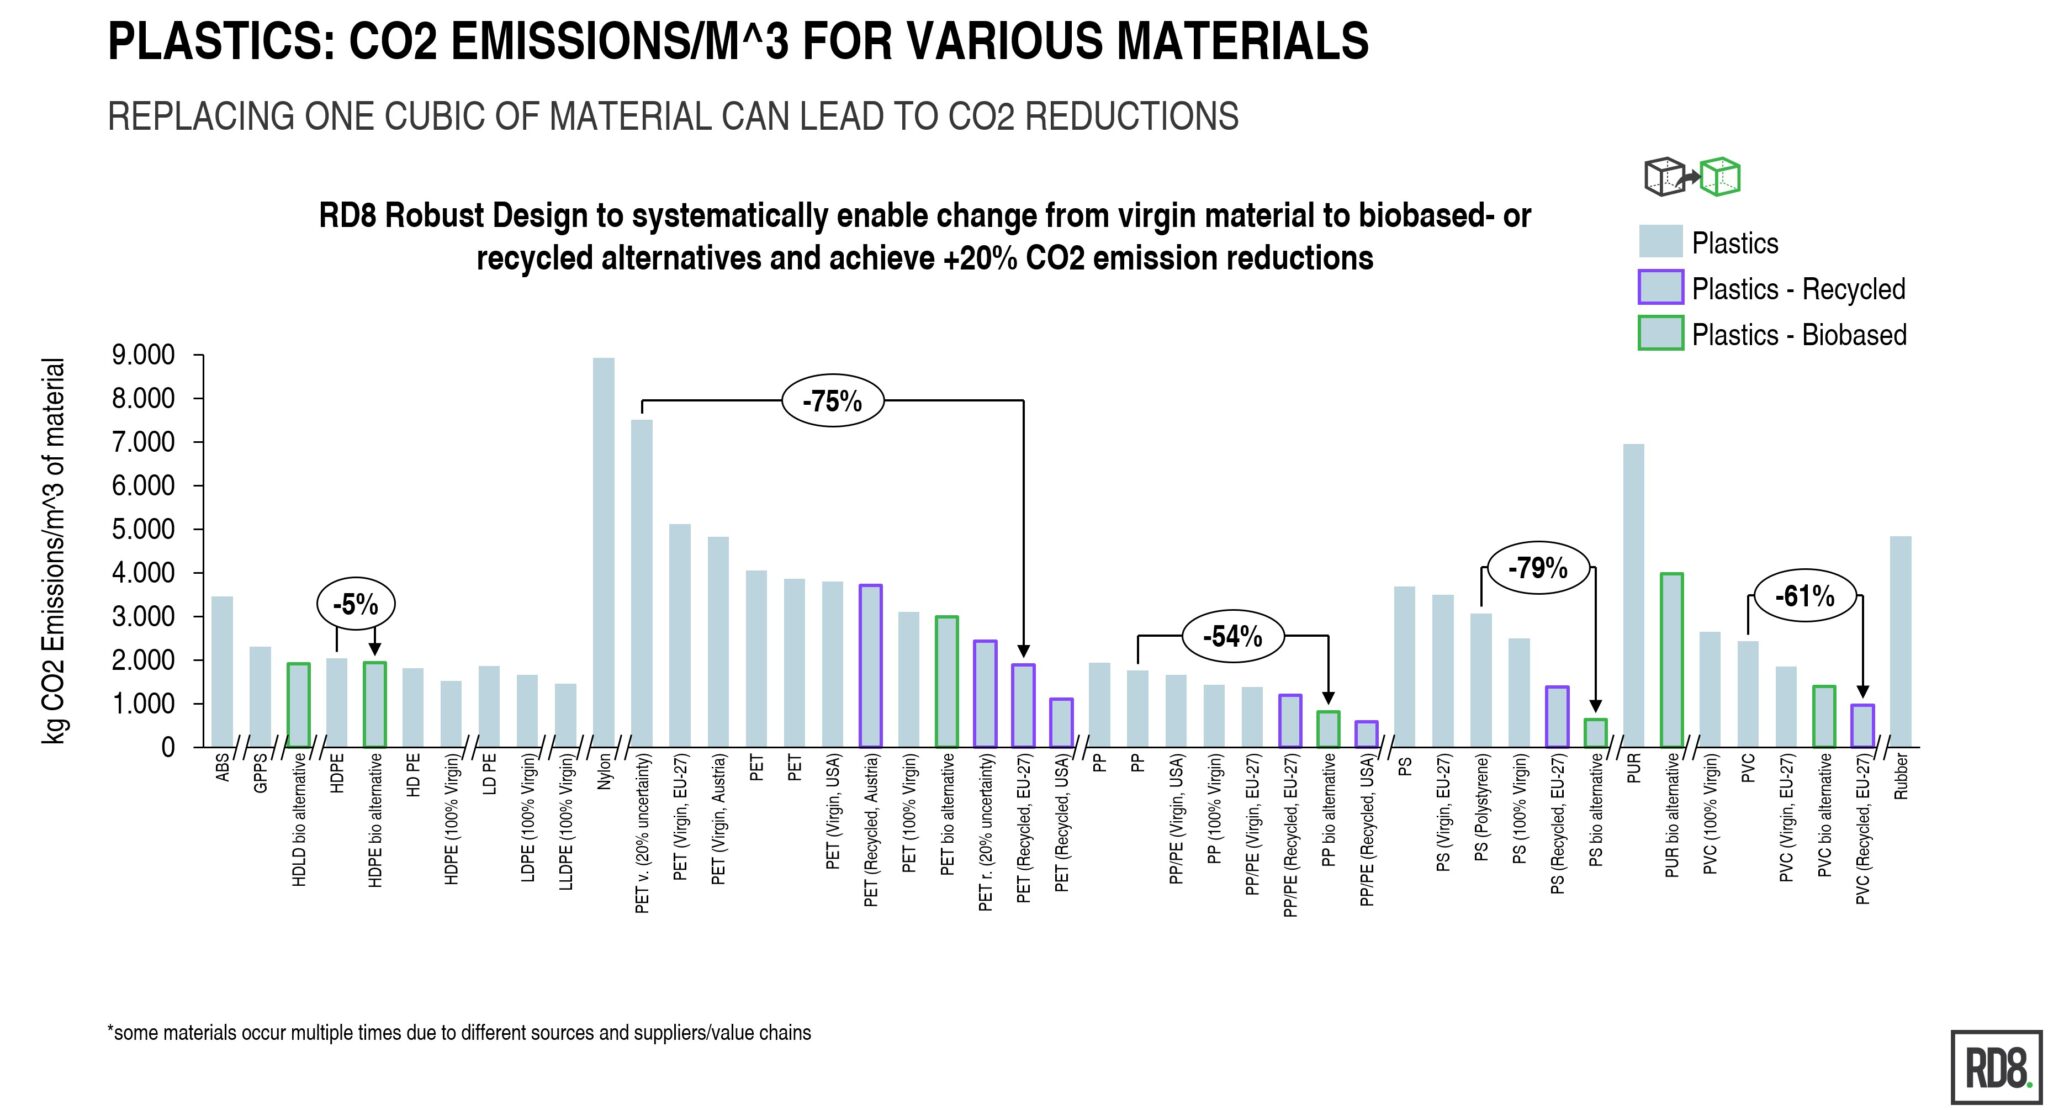
Material substitution can lead to CO2 reductions by use of biobased or recylcled plastics

RD8 RES can systematically enable changes from virgin material to biobased- or recycled alternatives and in most cases reduce CO2 emissions by more than 20%.
For example, it is possible to save 79% by changing from PS to PS bio alternative
Some product types are mainly made of plastic parts therefore a special plot for these.
Are you interested in hearing more about CO2
reductions by green material substitution?
Book a meeting with us already today


